Connecting healthcare professionals to data-driven insights
How can doctors use the information they collect every day to better understand behavioral health and take care of patients with mental illnesses? Our new interactive for athenaInsight gives healthcare professionals access to data-driven insights into American mental health.
athenaInsight is daily news hub that aims to connect healthcare professionals with data-driven performance insight and proven, replicable best practices. Their ever-growing data set includes athenahealth’s nationwide network of over 85,000 providers and 80 million patients—unprecedented visibility into American healthcare. athenaInsight came to us for help visualizing their data and making it accessible to their audience.
Finding stories in a trove of data
athenaInsight has a massive trove of data about the behavioral health of patients. They came to us as visualization experts, to turn the numerical data into charts that told stories.
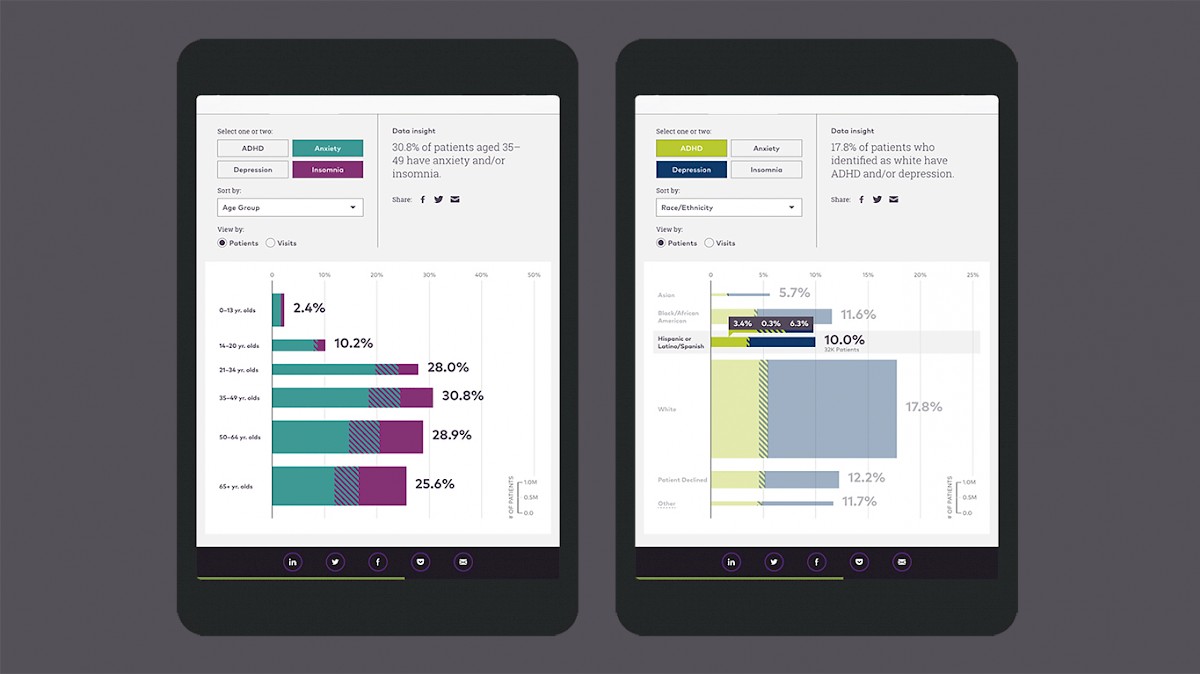
We began by looking for patterns and stories in the data. What connections could be found between demographics, doctor visits, and mental health diagnoses? We created simple bar charts with D3.js to visualize the data broken down by different population demographics and clinical factor: gender, age, insurance type, and ethnicity.
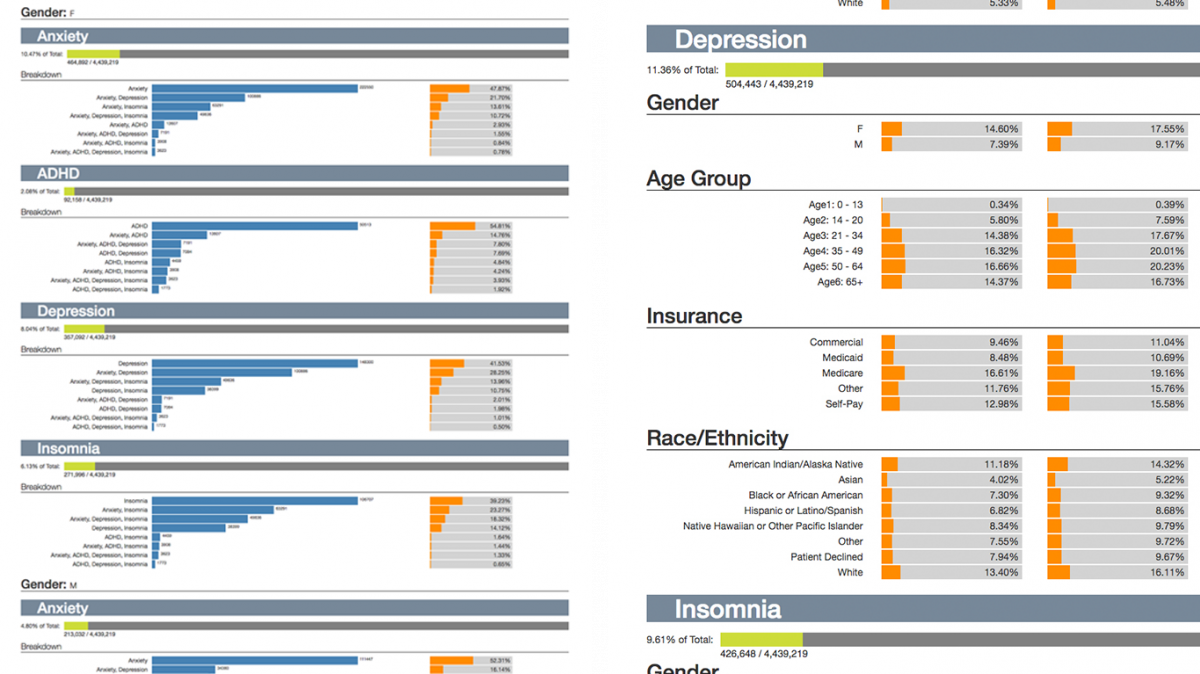
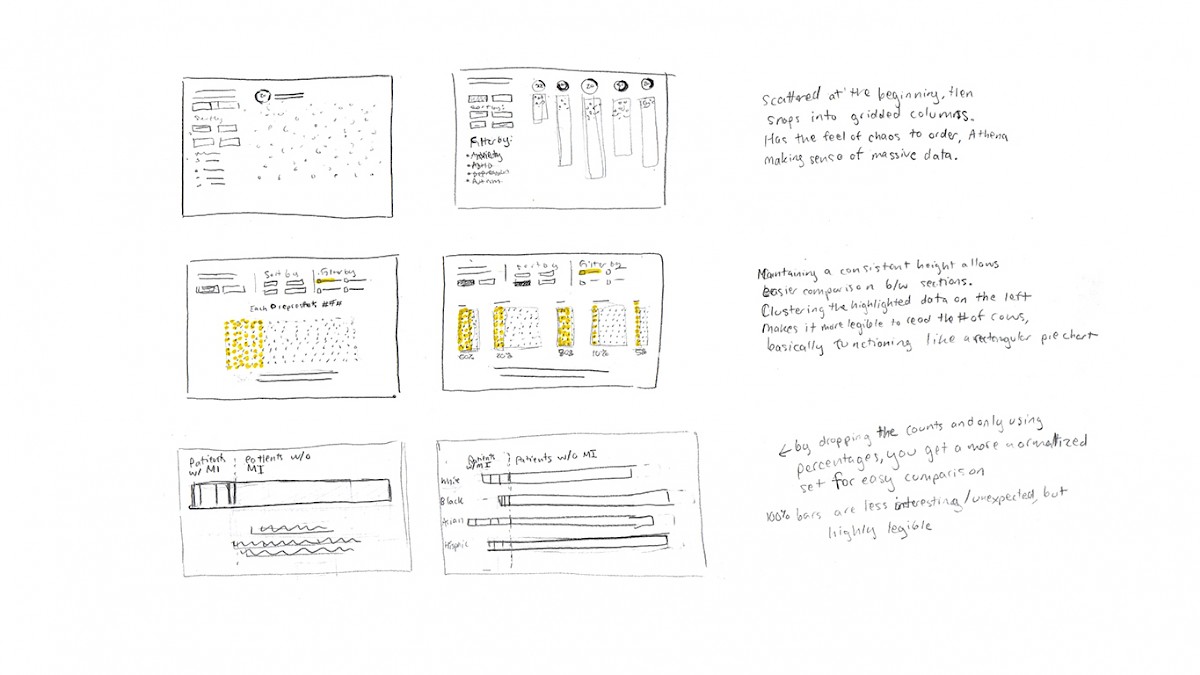
As we looked for correlations and anomalies, we quickly discovered that certain population groups were underrepresented in the data set. For example, there was more data for female patients than male patients. Normalizing the data and using percentages instead of patient counts gave us a clearer view into the picture of mental health for each demographic slice.
Some stories we found in the data:
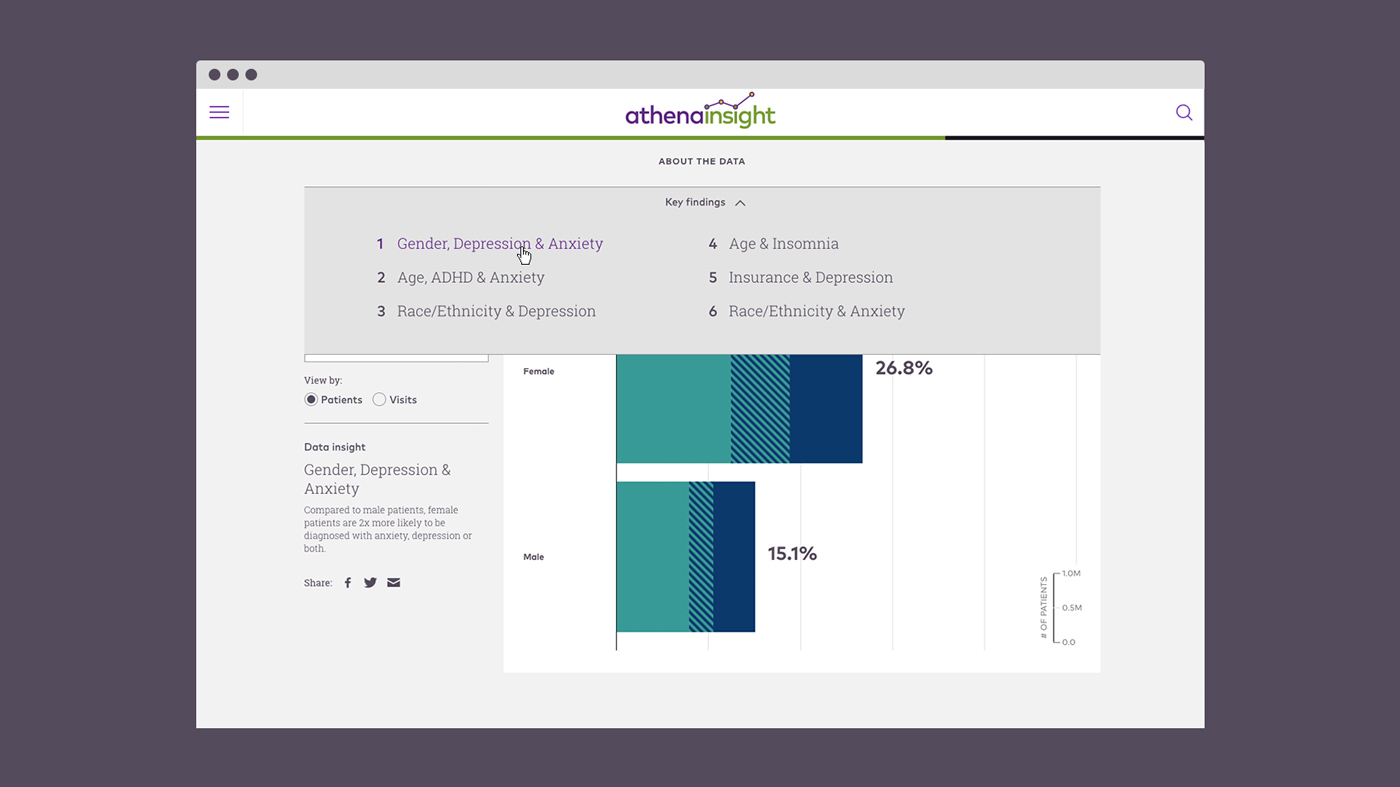
- Women are more likely to be diagnosed for depression and anxiety than men
- There are strong correlations between age and insomnia / ADHD diagnoses
- People are often diagnosed with multiple mental illnesses
Reinforcing the data story with design
It was clear from the initial dive into the data that overall picture of American mental health is composed of many interconnected stories. How could our single visualization encapsulate a range of stories without overwhelming the viewer? We used interactivity to spotlight these stories one-at-a-time—making it easier to understand, sort, and find insight in the data. The user can quickly reconfigure the data shown in the chart, sorting by demographic, spotlighting particular mental illnesses, and toggling between patients and doctor visits.
Insights enhanced by algorithm
In interactive visualizations like these, it’s easy to get lost in the staggering number of possible configurations. How could we ensure the audience found the most important stories?
We decided to guide users to key findings from the data with a menu that jumps to the 6 most important configurations. Custom copy was written to explain the key insights and offer additional context, but there were still 94 configurations of the chart with more stories to tell. We designed a method of generating insights from every configuration of the tool, working with copywriters at athenaInsight to algorithmically generate a human-readable insight for every configuration of the chart.
Sharing distinct configurations
Shareability was a key concern for athenaInsight. As a growing news platform, content-worth-sharing brings new audiences to the site and extends the reach of their data-driven insights. How can a chart like this be personalized, so that a reader can share a story that matters to them?
We made it possible to share particular insights by creating a system that generates unique urls for every possible configuration of the visualization, allowing people to share the direct link. Health professionals can locate a particular insight that resonates with their own work and interests and share that specific chart with their colleagues.
Full functionality across screen sizes
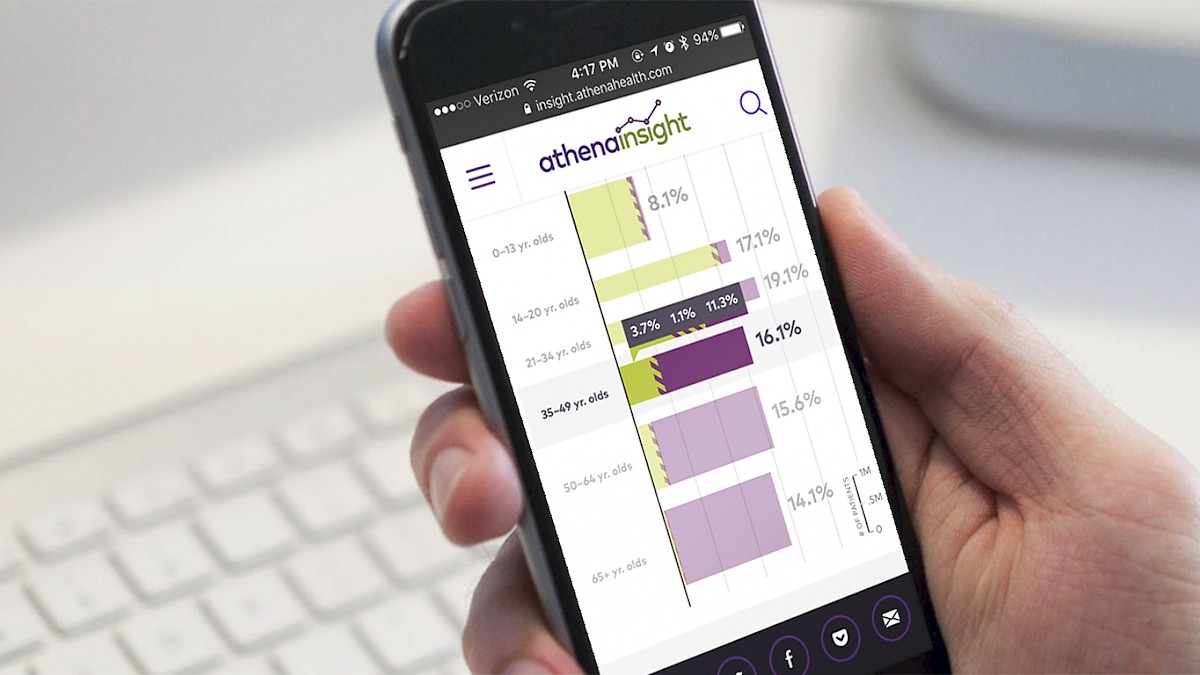
Healthcare professionals access online resources in many different ways, so the visualization needed to be responsive. What about the busy execs who only read things on their phones? athenaInsight wanted to ensure that both C-suite execs and busy healthcare professionals could access the visualization at their convenience, whether on the big screen or on the go.
We addressed these concerns by programming a responsive page layout and universal interactivity that functions on screens of all sizes. We also use a color palette with high contrast, for better performance on older screen tech, black & white printouts, and color-blindness accessibility.
Looking at the data in new ways like this can improve our understanding of the healthcare system and give professionals the data-driven insights they need to improve care. We're working on additional visualizations and interactives for athenaInsight and look forward to sharing them with you soon. Head over to athenaInsight to check out the interactive and explore the data on behavioral health.